The dynamic assembly of proteins must be spatially and temporally coordinated for essential processes to occur however technical limitations have hampered our understanding of such protein assembly through lack of spatially resolved, dynamic information on ensembles of molecules. The Manley lab has combined automated super-resolution fluorescence imaging techniques with live cell imaging and single molecule tracking to determine how the dynamics of protein assembly are coordinated.
Humans are remarkably visual creatures, processing visual information in a fraction of a second and devoting more of our brain to vision than the other four senses combined. Perhaps it is not surprising then, that imaging technologies have developed into a powerful tool for medicine and science. In particular, light microscopy has been put to use since the 17th century for revealing biological processes, strongly impacting our understanding of how living systems work at the cellular and sub-cellular level. Until present day, advances in optical design, large numerical aperture objectives and the development of fluorescence microscopy greatly improved image quality and information content by allowing specific molecules to be highlighted. Nevertheless, until recently, the theoretical resolution of light microscopy remained limited to ~200 nm in the lateral and ~500 nm in axial direction due to the diffraction of light.
An early approach to surpass the resolution limit of light microscopes was to harness electrons instead of photons. Since electrons have a shorter wavelength, about 1 nm, the theoretical limit is improved by two orders of magnitude. Indeed, electron microscopy has been proven to be a powerful tool for revealing the ultrastructure of cells and organelles. However, using the intrinsic electron density of samples as the contrast agent limits the possibility of highlighting individual cellular components. Moreover, the high electron doses required thus far exclude the possibility of observing living cells.
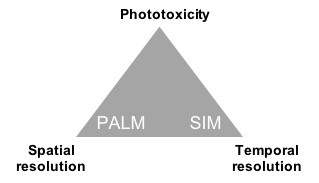
Over the past 10-15 years, new technologies have gone beyond the diffraction limit of optical microscopy, culminating in the 2014 Nobel Prize in chemistry to several inventors (Betzig, Hell, and Moerner). These “super-resolution” technologies are based on exploiting non-linearities in the interaction of light with fluorophores, or the interference properties of light. With these methods, a trade-off still remains between spatial resolution, temporal resolution and phototoxicity (Fig. 1). Thus, we often combine multiple methods and refine our imaging parameters depending on the scientific question and the sample. The main techniques used in my group are:
- Structured illumination microscopy (SIM), based on interference between the sample features and patterned excitation (1, 2, 3). SIM is capable of high temporal resolution, up to 100 frames per second in the case of instant SIM (8), and moderate phototoxicity, but only a ~2x improvement in spatial resolution.
- Photo-Activation Localization Microscopy (PALM) and Stochastic Optical Reconstruction Microscopy (STORM), based on the localization of single molecules by temporally separating their excitation. This method is capable of molecular-scale resolution, but is slow, typically 1 frame per second, and in many cases is too phototoxic for time-lapse imaging.
My group is an interdisciplinary and highly collaborative team, that both develops and applies super-resolution microscopy. Our main technological developments have been for automated and high-throughput super-resolution microscopy. We are investigating questions related to the structural organization and the dynamic behavior of cellular organelles and protein complexes in mammalian, bacterial, and yeast cells.
Structured illumination microscopy for live-cell imaging
Classical structured illumination microscopy bypasses the diffraction limit by taking advantage of optical interference, commonly called “Moiré fringes”. These fringes can be observed when two repetitive patterns are placed over another and form interference patterns, for example two chain-link fences. A slight displacement of one of the two patterns can create large-scale changes in the Moiré pattern, effectively amplifying differences and shifting information from below to above the diffraction limit. Structured illumination microscopy exploits this effect by illuminating the sample with a pattern, instead of a uniform field of light, to produce a wide-field Moiré pattern that is collected through the objective. Based on several interference patterns, an image of the sample is computationally reconstructed with twice the normal resolution (~100 nm in the lateral and 300nm in the axial direction). A typical acquisition time for conventional SIM is around 1 second per frame for single color and 6-8 seconds per frame for dual color. Thus, it is possible to collect time-lapse SIM images of live cells with illuminations and rates similar to wide-field or confocal microscopy.
Recent technical developments have allowed even higher spatial (∼50 nm lateral, 7, 6) or temporal (∼100 Hz, 8) resolutions with “non-linear” and “instant” structured illumination microscopy. We have built an instant SIM (iSIM), which is based on multi-point scanned illumination. This enables acquisition speeds up to 100 Hz, while maintaining a two-fold increase in resolution (8). Unlike other structured illumination microscopes, iSIM uses optical instead of digital image-processing steps and allows multicolor volumetric measurements up to tens of microns in depth, with equal improvement in axial resolution. We are currently addressing a limitation of the microscope by integrating flat-field illumination, using a technique developed in our lab to homogenize the image quality over the entire field of view (9).
We are using both SIM and iSIM to study the dynamic behavior of bacteria and mitochondria.
Live-cell structured illumination microscopy of mitochondrial dynamics
Mitochondria – commonly referred to as “the powerhouse of the cell” – are cellular organelles that host energy production, in form of ATP synthesis. Although their appearance ranges widely between elongated networks and fragmented punctae, their diameter typically remains between 0.4-1.0 µm: just at the diffraction limit. Their ultrastructure has been well-described with electron microscopy, but their dynamic behavior is far less understood. This knowledge gap is important, since mitochondria form a highly dynamic network by dividing and fusing to adjust to the cell’s metabolic needs. Disruption of their dynamic behavior can lead to pathology and is linked to a range of human diseases, such as diabetes, cancer and neurodegeneration.
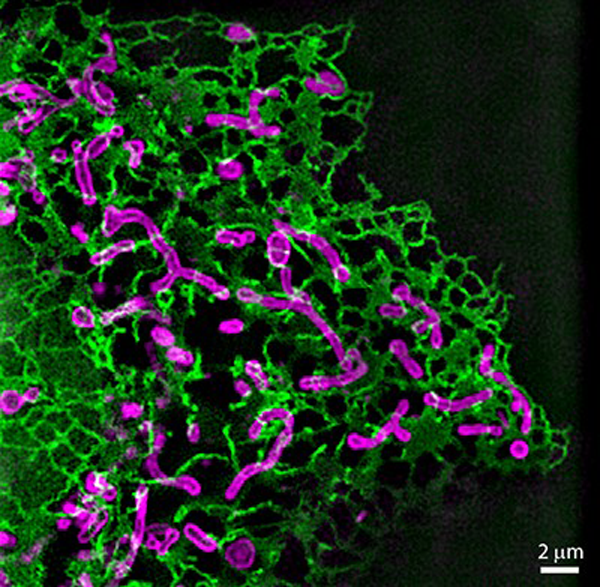
We are using multi-color live-cell SIM to visualize the dynamic behavior of mitochondria and their interactions with other cellular structures (Fig. 2), with a current focus on mitochondrial division. Our aim is to unravel the physical and biochemical principles and intracellular signals underlying fission. In collaboration with fellow NCCR member Aurélien Roux (UNIGE), an expert in membrane biophysics, we studied the kinetics of membrane deformation to reveal the physical basis of mitochondrial division. By quantifying changes in mitochondrial membrane geometry and interactions with proteins of the division machinery, we developed a model of the energetic requirements for fission. This revealed that elastic energy and tension govern the kinetics and probability of mitochondrial division (10).
In addition to developing a physical framework, we are also investigating the metabolic and bioenergetics changes associated with mitochondrial division on a single-organelle level. Multi-color live-cell super-resolution microscopy enables us to use previously established cell biological tools and biosensors for observing changes on a single-organelle level. With this, we hope to identify physiological changes (e.g. pH, reactive oxygen species, membrane potential or Ca2+ concentration) and stimuli that precede fission. As increased fission rates are a common feature in pathology, identification of fission triggers might give important hints for therapeutic strategies. These experiments are technically challenging, as such signals can be in the millisecond range of and sometimes require ratiometric measurements. Thus, we are looking forward to applying iSIM to our investigations.
Bacterial cell shape dynamics revealed by SIM imaging and quantitative image analysis
Cell size and shape are important features for bacteria, and must be controlled and maintained between generations, as well as adapting to environmental changes. Cell size is tightly regulated at different steps of the cell division cycle. Recently, it has been shown that some bacteria achieve size homeostasis by controlling the amount of elongation over a cell cycle, independent of length at birth. It is widely assumed that cell size regulation acts at the start of division. However, in many bacterial species, such as Caulobacter crescentus, the process of division represents a significant fraction of the cell cycle time, during which cells continue to elongate. However, the impact of constriction rate on cell size control and homeostasis remains obscure, due to the diffraction-limited size of the constriction.
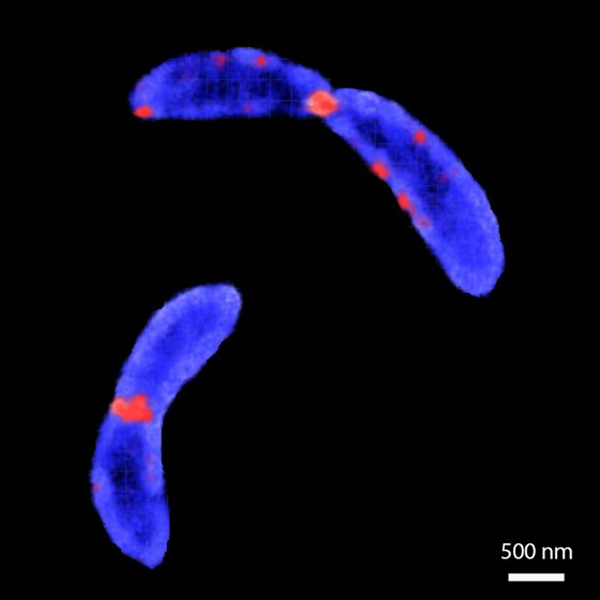
We used structured illumination microscopy to resolve the shape of synchronized bacteria (C. crescentus), while they progressed through the cell cycle. Dual-color time-lapse movies of bacterial inner membrane and division proteins as cell cycle landmarks were processed with a custom-written software that measured cell shape at each time-point and identified the onset of constriction, as well as estimating elongation and constriction rates. We found that when bacteria modulate their constriction rate during cell division, their size is affected. Additionally, cells tune their constriction speed to compensate for variation in elongation before constriction. Thus, perturbing the constriction rate has significant impact on the cell size independent of the elongation rate (11).
Single molecule localization microscopy for structural analysis of protein complexes
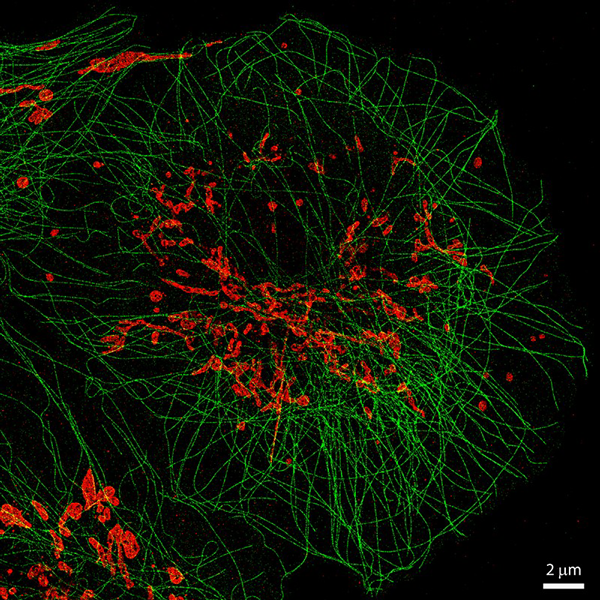
While SIM has proven to be a powerful tool to capture dynamic processes in cells, a deeper insight into the structural organization of cellular components requires higher resolution. Single molecule localization microscopy (SMLM), has found another way to circumvent the resolution limit. While two fluorophores which are closer than 200 nm cannot be distinguished if they are both emitting light at the same time, they can be by maintaining them in different states. By putting fluorophores in “on” and “off” states, individual fluorophores are separated in space and time, and their positions can be determined with sub-diffraction precision. Fluorophores are allowed to sample these “on” and “off” states over thousands to ten-thousands of cycles and super-resolution images are reconstructed from their positions. As fluorophores, one can either use genetically encoded photo-activatable proteins (PALM) or photo-switchable synthetic dyes (STORM).
Because the accuracy of single molecule localization is typically ~10 nanometers, the structural resolution can reach down to 30 nm laterally. Axial resolution can also be improved, typically down to 50 nm, by shaping and calibrating the microscope’s response to a molecule, which can be thought of as a point source of light. However, the increase in resolution comes with the cost of image acquisition. The timescale of acquiring a super-resolved image in one plane is typically in the range of minutes. For many biological processes, this timescale is too long to capture dynamic events. Moreover, SMLM requires the use of special fluorophores and imaging media to realize the photo-switching, and usually requires high illumination irradiance. Nevertheless, over the last years, these approaches have given fundamentally new insights into cellular architecture, molecular organization of molecules or proteins and single particle dynamics.
Multi-color single particle reconstruction of protein complexes
Cryo-electron microscopy (EM) has developed into a major tool for structural biology, and nowadays can resolve multi-protein complexes at atomic resolution. But while it is a powerful tool to reveal the cellular ultrastructure, it is harder to obtain information about molecular identity. Multi-protein complexes, such as the centriole, can contain hundreds of protein species whose precise structural arrangement is critical for proper function.
In collaboration with the group of Pierre Gönczy (EPFL), we have been generating multi-color 3D reconstructions of the human centriole using single-molecule localization microscopy. For this, several thousands of fluorescently labelled protein complexes are acquired with high-throughput STORM. With an automated analysis pipeline, the particles are then segmented, filtered and classified according to their orientation. Ultimately, we can generate 3D protein maps with resolutions on the order of 50 nm, including off-axis asymmetric features such as the daughter, or procentriole (12).
Structural rearrangements of TOR1 protein
In collaboration with the lab of Robbie Loewith (UNIGE), also in the NCCR Chemical Biology, we combined different imaging approaches to unravel the structure of the protein complex TORC1 (13). The protein ‘target of rapamycin’ (TOR) is a well-conserved kinase that nucleates into two large multiprotein complexes, TORC1 and TORC2. Both complexes are crucial for cell growth and stress response, as they integrate extracellular signals and control protein synthesis. In budding yeast, TORC1 is either distributed in a uniform granular arrangement around the vacuole or forms distinct single foci. Although these foci have been observed, their structural organization remained largely unknown.
Due to their small size, the foci appear as single spots using conventional confocal microscopy, and by calibrating the GFP signal each focus was estimated to contain several hundred TORC1 dimers. We performed STORM to study the organization of TORC1 foci at the nanometer scale. In reconstructed STORM images, we observed particles of different size and shape. After aligning and averaging several hundred particles, we found that the observed shapes could be explained by different orientations of the same object, which is organized as a hollow cylinder. The group of Paul Guichard (UNIGE) further showed with EM that purified particles matched this description, and mapped the mammalian TORC1 complex into the reconstruction to show that the active site is occluded in this higher-order arrangement. This project exemplified how different microscopy techniques can lead to a deep structural understanding of protein complexes across multiple length scales.
References
- Gustafsson, M. G. L., Journal of Microscopy, 2000, 198 (2), 82-87.
- Shao, L.; Kner, P.; Rego, E. H.; Gustafsson, M. G. L., Nat Meth 2011, 8 (12), 1044-1048.
- Schermelleh, L.; Carlton, P. M.; Haase, S.; Shao, L.; Winoto, L.; Kner, P.; Burke, B.; Cardoso, M. C.; Agard, D. A.; Gustafsson, M. G. L.; Leonhardt, H.; Sedat, J. W., Science 2008, 320 (5881), 1332-1336.
- Betzig, E.; Patterson, G. H.; Sougrat, R.; Lindwasser, O. W.; Olenych, S.; Bonifacino, J. S.; Davidson, M. W.; Lippincott-Schwartz, J.; Hess, H. F., Science 2006, 313 (5793), 1642-1645.
- Rust, M. J.; Bates, M.; Zhuang, X., Nat Meth 2006, 3 (10), 793-5.
- Rego, E. H.; Shao, L.; Macklin, J. J.; Winoto, L.; Johansson, G. A.; Kamps-Hughes, N.; Davidson, M. W.; Gustafsson, M. G. L., Proc Natl Acad Sci USA 2012, 109 (3), E135-E143.
- Gustafsson, M. G. L., Proc Natl Acad Sci USA 2005, 102 (37), 13081-13086.
- York, A. G.; Chandris, P.; Nogare, D. D.; Head, J.; Wawrzusin, P.; Fischer, R. S.; Chitnis, A.; Shroff, H., Nat Meth 2013, 10 (11), 1122-1130.
- Douglass, K. M.; Sieben, C.; Archetti, A.; Lambert, A.; Manley, S., Nature Photonics 2016, 10 (11), 705-708.
- Carlini, L.; Mahecic, D.; Kleele, T.; Roux, A.; Manley, S., bioRxiv 2018.
- Lambert, A.; Vanhecke, A.; Archetti, A.; Holden, S.; Schaber, F.; Pincus, Z.; Laub, M. T.; Goley, E. D.; Manley, S., bioRxiv 2018.
- Sieben, C.; Banterle, N.; Douglass, K.; Gonczy, P.; Manley, S., bioRxiv 2018.
- Prouteau, M.; Desfosses, A.; Sieben, C.; Bourgoint, C.; Mozaffari, N. L.; Demurtas, D.; Mitra, A. K.; Guichard, P.; Manley, S.; Loewith, R., Nature 2017, 550 (7675), 265-269.
Article’s authors: Tatjana Kleele and Suliana Manley, Laboratory of Experimental Biophysics, EPFL
Leave a comment
The editors reserve the right not to publish comments or to abridge them.